How to trace a form/session in Oracle Apps

We need to find out the code running behind the scenes to identify the issue. We need to generate a trace file and check that file.
Method 1: Generate debug log file
Step 1: Set profile option values
Set the following profile options on the User level so that it does not affect the entire application.
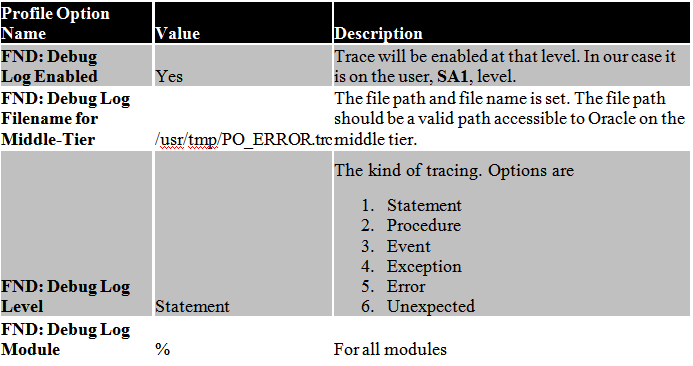
Responsibility: System Administrator
Navigation: Profile > System
Query for User = SA1 and Profile = FND%LOG%

Click on Find and change the values on user level.

Execute the query
select max(log_sequence) from fnd_log_messages

Note the number, i.e. 384854630
Step 2: Reproduce the error
Recreate the error in Oracle Apps and Execute the query
select * from fnd_log_messages
where log_sequence > 34854630 – Max seq num from query of Step 2
and module like ‘%’
order by log_sequence

Step 3: Check the log file
Log in to the middle tier operating system and go to the path set in the profile option name, FND: Debug Log Filename for Middle-Tier. We have set the value to /usr/tmp/PO_ERROR.trc. let us go to /usr/tmp directory
$ cd /usr/tmp

Now check for the trace file, PO_ERROR.trc
$ ls –l PO_ERROR.trc

Open the trace file and review
$ view PO_ERROR.trc

You can go through the file and analyse the issue.
Method 2: Generate session level trace
Step 1: Enable trace
Open the form and reach the point from which you want to enable trace and generate the file. Click on Help > Diagnostics > Trace > Regular Trace on the menu.

Once trace is enabled Oracle will give a popup message with the trace file name and location and mentioning that trace has been enabled.

Note the file name. It is DEV_ora_22141_SA1.trc. The location is the same as the value that you get from running the following query,
select * from v$parameter where name = ‘user_dump_dest’

Step 2: Replicate the error
Now you need to recreate the error in Oracle Apps.
Step 3: Turn off trace
We shall turn off trace or else every action we take on this session after the error will also be added into the trace file.
Click on Help > Diagnostics > Trace > No Trace
Now you will again get a popup message saying that tracing is disabled.

Step 4: Review the trace file
Let us go to the trace directory on the middle tier or application server.
$ cd /d02/oraprod/proddb/11.2.0/admin/DEV_eyerpqa/diag/rdbms/dev/DEV/trace

Search for the trace file
$ ls –ltr DEV_ora_22141_SA1.trc

Now that we know that the trace file has been generated, we shall view the file
$ view DEV_ora_22141_SA1.trc

The file is as follows,

Close the file. We shall generate a TKPROF output so that the file can be easily read.
Step 5: Generate TKPROF output
On the command prompt type in
$ tkprof DEV_ora_22141_SA1.trc output.tkp

Open the generated file, output.tkp
$ view output.tkp

Now it is a lot easier to identify all the SQLs in the trace file than the trace file.
The difference between the 2 methods

You can now decide for yourself what kind of trace you need and work accordingly.
Challa.
No comments:
Post a Comment